The first question is which profit you mean
A founder asks, “We sold more yesterday. Why did we make less?” A useful AI workflow must answer with a bridge between two comparable periods, traceable numbers and a responsible next action. A paragraph that repeats sales, ad spend and ROAS does not explain profit.
Separate three products. A daily contribution view helps the commercial team act before the month closes. A management P&L adds the agreed operating-cost treatment. The statutory accounts follow the finance team’s accounting policies and close controls. Give each a distinct label, owner and revision state. A provisional daily estimate should never quietly become the final monthly profit.
Start with a written metric contract: reporting entity, timezone, currency, recognition date, treatment of shipping income, returns, taxes, cost method and ad-spend cut-off. These choices belong to finance. The language model can explain them, but should not decide them differently each morning.
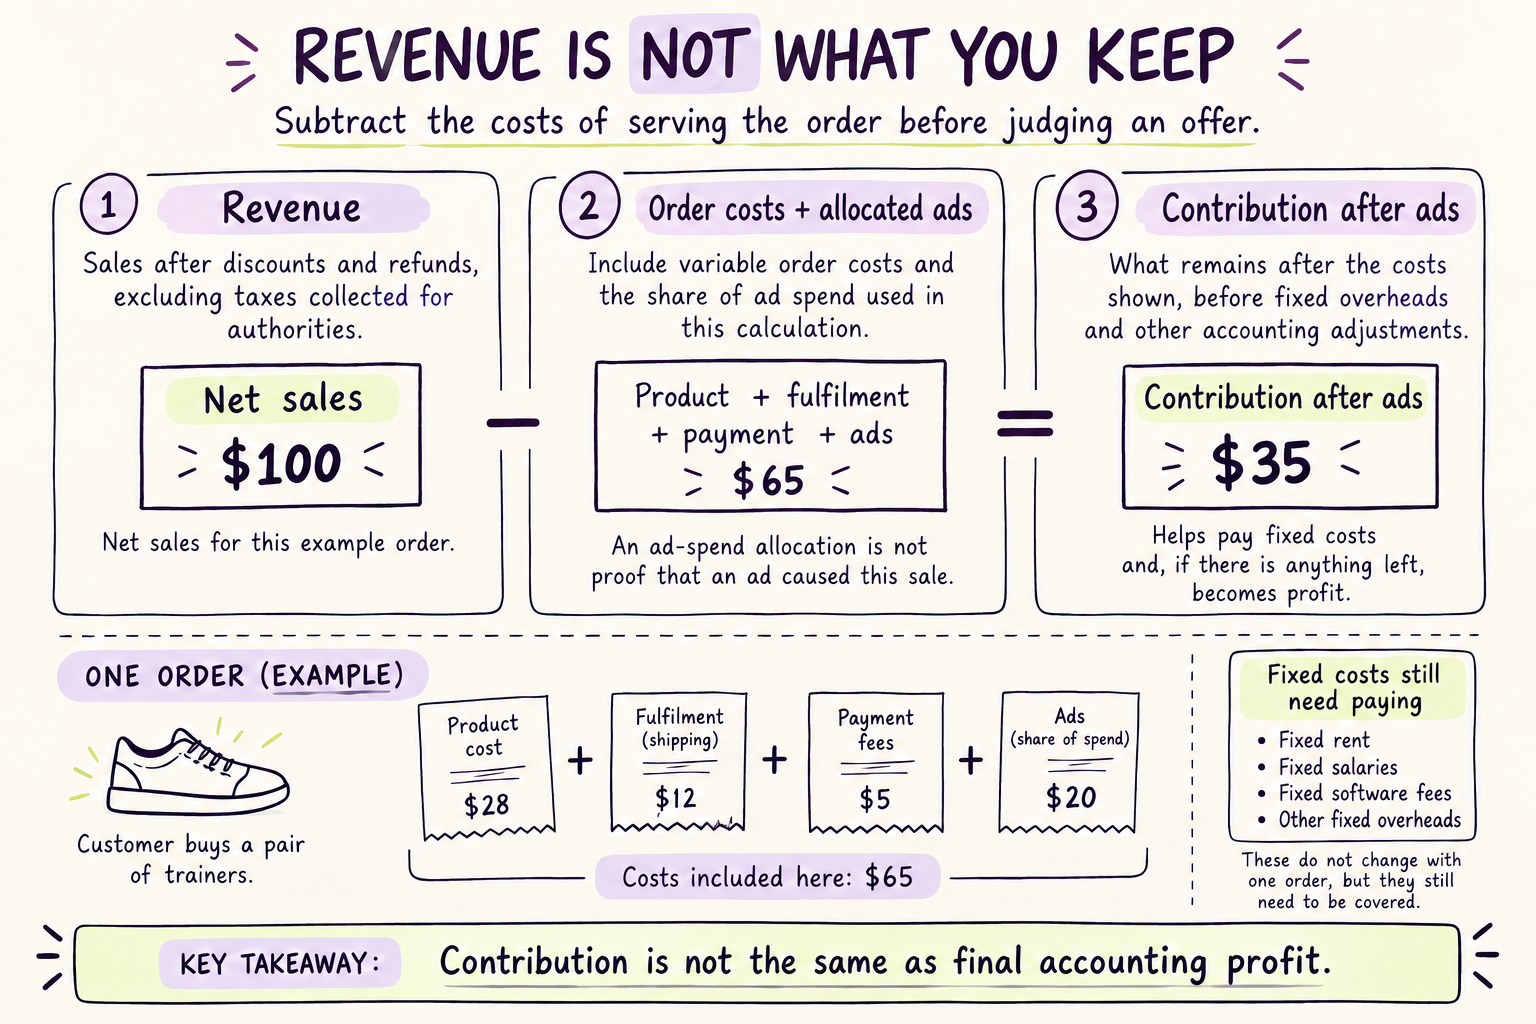
Read the visual explanation
Start with net sales after discounts, returns and collected sales tax.
Include the relevant order costs and clearly state how advertising cost is assigned.
What remains after those costs can contribute to fixed costs and profit.
Illustrative teaching example. The steps above are repeated in readable text below; depicted records are not customer results.
A worked daily contribution waterfall
This fictional example is a calculation design, not a Looqus customer result. Product gross sales are $50,000. Discounts are $5,000 and product sales reversals are $3,000, leaving product net sales of $42,000. Shipping income of $1,500 brings the example’s operating revenue base to $43,500. Taxes collected for authorities are excluded from this model.
Subtract $16,800 in matched product costs, $3,600 in fulfilment and carrier expense, $1,300 in payment and marketplace charges, $800 in separately recorded return handling and $12,000 in advertising. The result is $9,000 of contribution before fixed operating costs, or 20.7% of the $43,500 revenue base. Do not call this net profit. Salaries, rent, software, finance costs and other expenses are outside this particular view.
Shopify defines net sales separately from total sales, and its sales reports do not establish the cash received. Use the source definitions when mapping the data rather than assuming the largest dashboard number is the revenue denominator. [1]
For comparison, suppose the previous comparable day produced $10,500 contribution on $40,000 revenue. The bridge is +$3,500 revenue, less $1,200 additional product costs, $500 additional variable costs and $3,300 additional advertising. Contribution has fallen by $1,500 even though revenue rose. These movements sum exactly to the change. The explanation should identify those drivers before proposing a remedy.
Where $43,500 becomes $9,000.
Product net sales plus shipping income, less the costs of serving and acquiring those orders.
$9,000 contribution before fixed operating costs. This is not net profit or a customer result. The supporting table below explains each line.
Build the ledger before asking for a narrative
Create a fact table at the transaction or line level, with an immutable source ID, event type, order ID, SKU, quantity, currency, amount, occurrence timestamp and ingestion timestamp. Keep adjustments as traceable events rather than silently overwriting yesterday’s number. Establish a canonical mapping for SKUs sold through the storefront, marketplaces and offline invoices.
Use deterministic code or database queries for calculations. Store the query version and metric definition alongside each result. The model receives the checked aggregates and a permitted way to retrieve supporting records. It can investigate and explain a variance without being allowed to invent arithmetic or modify a closed ledger.
A sale, a shipment, a return authorization, a refund and a bank settlement have different timestamps. Decide which belongs in each view. Preserve both event time and business reporting date so a late-arriving adjustment can restate a period visibly. A return approved today may relate to last month’s promotion; the operational day view and the campaign cohort view can both be useful, but answer different questions.
Missing cost is a decision gate, not a zero
Suppose $6,000 of the day’s $42,000 product net sales has no matched cost record. The report should say that 85.7% of product net sales has cost coverage. It should not assign zero cost to the remaining sales and celebrate the resulting margin.
If finance approves a temporary 35% to 50% cost-ratio range for that exact missing subset, the uncertain cost is $2,100 to $3,000. Publish a contribution range and show the assumption, owner and expiry date. If no defensible estimate exists, publish the incomplete coverage and withhold the profit conclusion. The approved estimate is an input to the calculation, not a number generated because the model needs to finish its answer.
Shopify’s profit reporting depends on recorded product costs. A source-system cost field is not automatically a complete landed-cost ledger. [2] Imports may require freight and duty allocation; manufacturing may require materials, labour and overhead treatment; distributions may require rebates and landed-cost adjustments. Finance must specify the correct method and effective dates. Keep quantity and sales-value coverage separately so a large number of inexpensive matched units does not hide an expensive unmatched product.
Do not let ad attribution rewrite the accounts
Maintain a business contribution view based on actual recorded revenue and costs. Next to it, maintain channel attribution views with the platform, attribution window, timezone and reporting delay clearly stated. Meta and Google can each claim a conversion under their own rules. Adding their attributed revenue together is not a reconciliation to the company’s sales.
A platform ROAS movement is a diagnostic signal. It is not the same as incremental profit. When a campaign appears weak, inspect spend maturity, stock availability, discount depth, landing-page changes, cancellations and new-customer mix before changing budget. A same-day partial spend feed compared with a complete prior day can manufacture an improvement or decline.
The workflow can produce a decision packet: the affected campaign, comparable window, spend, contribution assumptions, data freshness, proposed budget change and the person who can approve it. A recommendation is not an executed change. If execution is authorized, record the platform response and the new setting, then review the effect at the agreed interval.
Make the explanation specific enough to act on
“Margins fell because costs increased” is not an operating answer. A better fictional explanation is: “The 20% bundle moved more units, but the carrier-cost assumption was for one parcel. Thirty-eight orders required a second parcel. The promotion’s contribution is lower than the dashboard estimate. Operations will verify parcel counts; finance will update the cost mapping; marketing will hold the next increase until the corrected view is available.”
Every material explanation should carry a period, a comparison basis, a quantified variance, supporting records, an alternative explanation considered and an action owner. Distinguish observed arithmetic from a causal hypothesis. The system can demonstrate that shipping expense rose; it may need parcel records to establish why.
Looqus specialists can carry the unresolved work across teams: obtain missing supplier costs, resolve a SKU mismatch, ask the carrier for the correct charge basis, and return a revised decision to the owner. The workflow is finished when the relevant decision and its evidence are recorded, not when an automated message says “analysis complete.”
Adapt the same architecture to the business model
For a US direct-to-consumer brand, begin with order lines, payment fees, advertising and fulfilment. For an Indian multichannel business, separately track marketplace settlements, cash-on-delivery collections, returns to origin and GST treatment according to the finance team’s policy. An order being placed is not proof that cash on delivery has been collected.
For a UAE or Omani importer, connect purchase receipts and the approved landed-cost allocation before comparing margins across products. For a Saudi distributor, keep customer-specific pricing, rebates, pack sizes and credit notes visible. Do not infer tax or revenue-recognition treatment from the country label; ask the responsible finance adviser to define it.
For manufacturing, a profitable quoted bill of materials may differ from actual production consumption, scrap, rework and delivery costs. Show quote margin, order contribution and the closed financial view as distinct stages. The same product identifier should connect them so the team can learn where the original assumption failed.
Acceptance tests for a daily AI P&L
Replay a completed period against a finance-approved control report. Introduce a duplicate order, a late refund, a missing SKU cost, a currency mismatch, a stale advertising feed and a restated carrier invoice. Check that each changes the correct period and creates a visible exception without duplicating revenue or hiding uncertainty.
Set release gates before the pilot: reconciliation tolerance, minimum cost coverage, maximum feed age, permitted restatements and who can close an exception. Thresholds depend on the business. Keep an explicit “not ready for a decision” state when those gates fail.
The daily delivery can fit on one screen: contribution and its status; a waterfall against the comparable period; data coverage and freshness; the three material drivers; and the actions with owners. Let the user open supporting rows instead of filling the first screen with every transaction. Monthly close should retain the complete history of revisions and approvals.
A sensible first scope is one legal entity, one reporting currency and one clearly defined contribution view. Prove that the numbers reconcile and that the team uses the resulting decisions. Add channels and deeper forecasting after that foundation works.
Put the decisions side by side
| Waterfall line | Illustrative amount | What the number means |
|---|---|---|
| Product net sales | $42,000 | Gross sales less discounts and product reversals |
| Shipping income | $1,500 | Separate revenue line in this example |
| Product cost | −$16,800 | Matched and checked |
| Fulfilment and carriers | −$3,600 | Actual or explicitly provisional |
| Payment and marketplace charges | −$1,300 | Avoid double-counting settlement deductions |
| Return handling | −$800 | Separate from reversal of product revenue |
| Advertising | −$12,000 | Same complete reporting window |
| Contribution | $9,000 | Before fixed operating costs; fictional calculation |
Sources and scope
Worked scenarios are illustrative designs, not customer results or performance guarantees. Confirm current product availability and applicable requirements before implementation.
AI does the work.We own the outcome.
Resolve the missing costs and mismatched records behind your daily numbers, so spending decisions start from an explanation your team can check.
- Agree the result
- Connect the work
- Own the follow-through

Follow the work, one decision at a time.
- Reconcile source records
- Calculate a defined margin
- Explain the movement
- Assign and verify the action