
Ecommerce attribution tools collect interaction and purchase records, connect the records they can legitimately identify, decide which interactions are eligible and assign conversion credit using a defined rule or model. They then combine that credit with spend or other measures for reporting. The result depends on collection coverage, identity, timing, revenue definitions and the selected attribution method.
That is why two dashboards can disagree without either simply adding the numbers incorrectly. One may recognize a different customer path, include an earlier touch, count a view rather than a click or report revenue before a refund. Attribution is a measurement construction that needs to be understood before it becomes a budget decision.
This guide explains public methods and documented platform distinctions. It does not reproduce a private vendor algorithm or claim that a synthetic demonstration reveals how every commercial product works. The interactive example on this page is a learning tool: changing a credit rule redistributes the same illustrative revenue; it does not create extra sales.
Begin with the records the tool can collect
Common inputs include page visits, campaign parameters, advertising clicks, permitted identifiers, purchase events, order records and refunds. Browser events describe observed activity on a device. Server or commerce integrations can provide transaction evidence even when the browser path is incomplete. Neither source independently supplies a complete account of every influence on a buyer.
Record what each input means and how it was collected. An order accepted by the commerce system differs from a payment captured, a parcel delivered and revenue retained after a return. A tool can only report the event and value supplied under its documented handling rules.
Google's ecommerce measurement documentation describes purchase and refund events and their transaction and item information. This illustrates why the implementation needs explicit event definitions rather than a generic conversion tag attached to any successful-looking page. Google Analytics ecommerce measurement
Keep permission and data use in the design. Server-side collection is not a way to bypass applicable consent, notice or platform obligations. The business needs an appropriate basis for the information it collects and shares, and a process for honoring relevant preferences and restrictions.
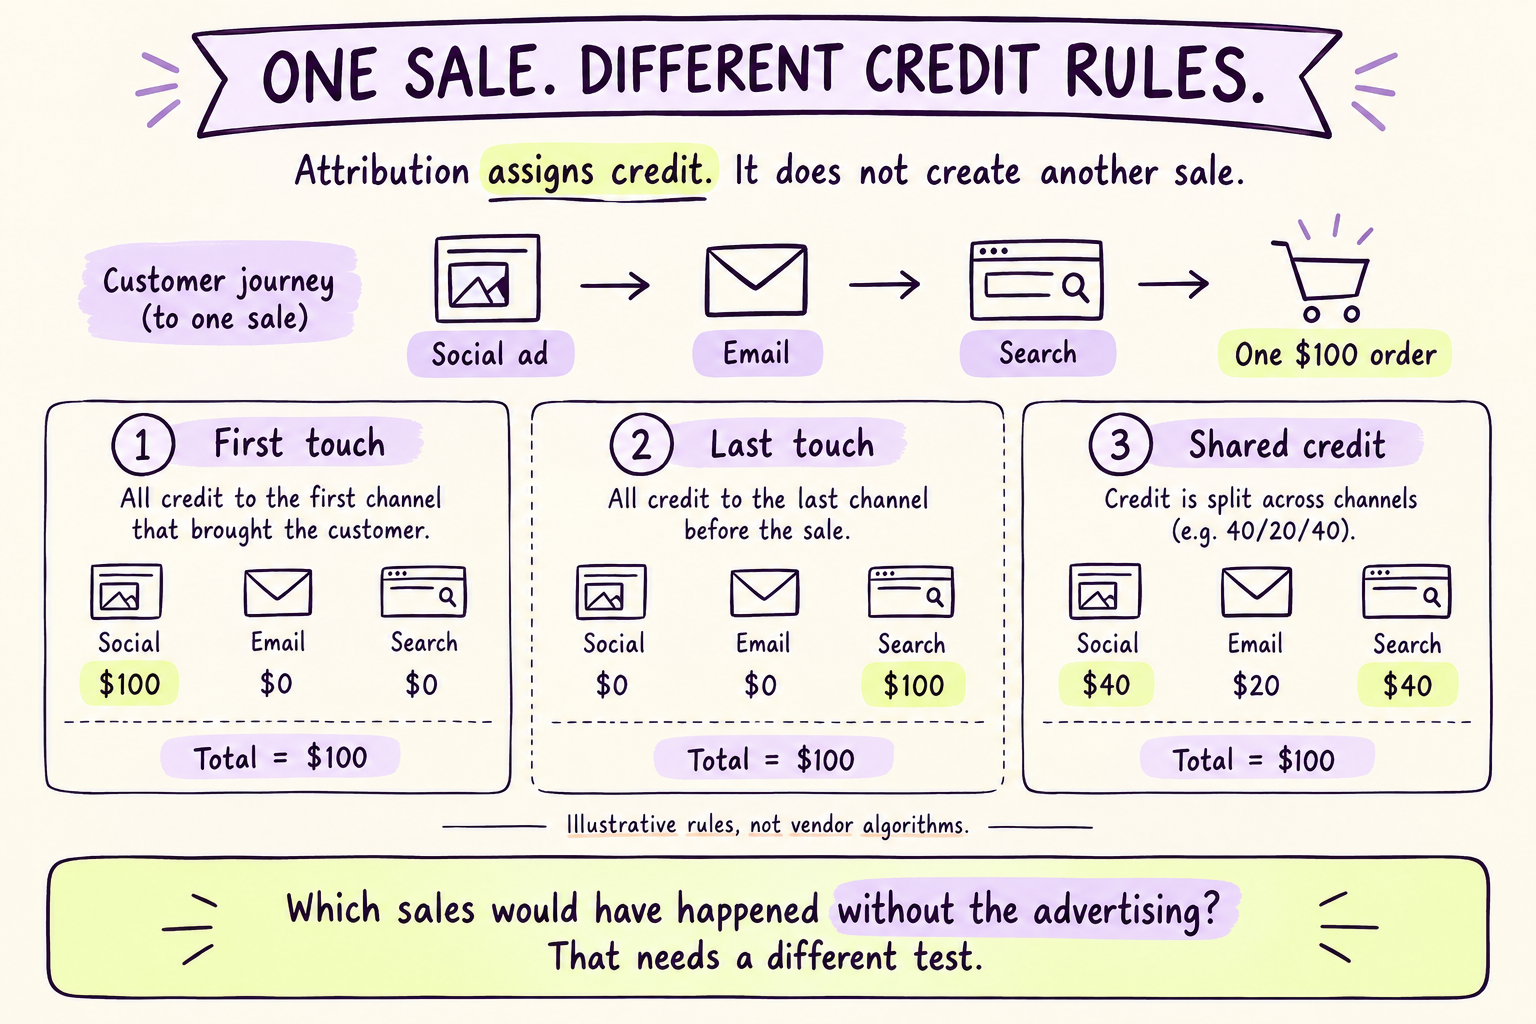
Read the visual explanation
First touch assigns this fictional $100 sale to the first observed channel.
Last touch assigns the same $100 sale to the final eligible channel.
An illustrative shared rule assigns $40, $20 and $40. Total revenue remains $100.
Illustrative teaching example. The steps above are repeated in readable text below; depicted records are not customer results.
Deduplicate events before assigning revenue
The same purchase can be reported by more than one path or sent again after a page reload or retry. The measurement system needs a stable transaction identity and a documented way to distinguish another copy of the same event from another genuine order.
Google Analytics documents transaction-ID deduplication for web purchase events, with specific implementation limitations. Test the relevant stream and identity behavior rather than assuming any repeated transaction ID is handled identically across every tool. Google Analytics transaction-ID deduplication
Fictional USD example. Monetary assumptions in this guide are illustrative US-dollar amounts, not quoted prices, measured results or exchange-rate conversions. The currency does not imply a US tax or legal setting.
A synthetic store with one USD 300 order does not have USD 600 revenue because both browser and server reported it. Conversely, two valid orders by one customer should not collapse into one because the integration reused an event identifier. Deduplication must preserve business identity, not merely reduce a suspiciously large total.
Reconcile to the commerce source before examining channel performance. Compare distinct orders and values, then investigate missing, repeated or mismatched records. A more sophisticated attribution model cannot repair an incorrect transaction ledger by allocating its mistakes more elegantly.
Collect and deduplicate
One purchase remains one transaction
Identify and filter
Only known eligible interactions enter the path
Allocate and reconcile
Credit follows the rule; refunds affect revenue
Conceptual guide by Looqus Editorial. Read the surrounding analysis for assumptions, exceptions and primary sources.
Interactive attribution · Three synthetic orders
Same orders. Different credit.
These simplified rules explain attribution mechanics. They do not reproduce any vendor's proprietary model or current reporting defaults.
| Channel | Credited revenue |
|---|---|
| Paid search | USD200.00 |
| Paid social | USD100.01 |
Default net credited revenue: USD300.01. Enable JavaScript to explore other rules.
Inspect the journeys and allocation rules
Order A: USD200.00; paid social20 days before purchase, email4 days before, paid search1 day before. Order B: USD150.00, fully refunded; paid social8 days before, organic search2 days before. Order C: USD100.01; email10 days before, paid social3 days before.
The window is inclusive. Missing eligible touches produce unattributed revenue. Equal-credit rounding allocates any remaining cents to earlier eligible touches so the sum always matches order revenue. A refund reduces credit to zero when selected. Removing an observation does not prove the channel had no influence. No causal counterfactual is estimated.
Understand how identity joins the journey
A path requires a relationship between interactions and the purchase. A logged-in identifier may connect some activity across devices when legitimately collected and supported. A device identifier can connect activity within a narrower context. Other observations may remain unlinked or modeled under a platform's documented rules.
Google Analytics describes reporting identity using options that can involve User-ID, device identity and modeling, depending on configuration and availability. That does not mean every anonymous visit becomes a known person or that all cross-device behavior is visible. Google Analytics reporting identity
Treat unknown as a valid state. A customer can discover a product offline, use another device or decline optional tracking. Post-purchase survey responses can add useful self-reported context, but they measure memory and interpretation rather than reconstruct a complete observed event path.
Identity joins also need restraint. Shared devices, household email addresses and forwarded links can create misleading connections. Do not infer personal identity from weak evidence or use hidden fingerprinting to defeat a customer's privacy choice. The report should communicate coverage and uncertainty instead of pretending the journey is fully observed.
Apply the window before applying the model
An attribution window defines which interactions can be considered in relation to a conversion. A seven-day rule and a thirty-day rule can include different touches from the same observed history. The model then allocates credit among the eligible interactions according to its logic.
Google Analytics documents lookback-window settings and their effect on attribution eligibility. Google Ads also distinguishes attribution-report lookback windows from conversion windows. Check the actual setting and report scope before comparing a number carrying the same label in two systems. Google Analytics attribution settings, Google Ads attribution reports
State whether the report groups by conversion date or interaction date. An order placed this week after a click last month may appear in different periods depending on the report. Late events and processing time create further movement. A timestamp disagreement can therefore masquerade as a campaign-performance disagreement.
Do not lengthen the window merely to improve a channel's reported return. Choose a defensible measurement policy aligned with the buying process, preserve it for comparison and document changes. A wider window increases what is eligible; it does not prove every included interaction caused the purchase.
Know what the common credit rules answer
Different rules reveal different aspects of the same observed path. Their usefulness depends on the decision and the quality of the underlying records. None is a universal statement about what the buyer would have done without advertising.
| Method | How it allocates credit conceptually | Important limitation |
|---|---|---|
| First eligible touch | Gives credit to the earliest eligible recorded interaction | Earlier unobserved discovery can be missing |
| Last eligible touch | Gives credit to the latest eligible recorded interaction | Can emphasize demand capture over earlier influence |
| Last non-direct touch | Uses the latest qualifying non-direct interaction under the defined rules | Direct handling and eligibility vary by product |
| Linear allocation | Divides credit across eligible recorded touches | Equal shares are a chosen convention |
| Data-driven attribution | Uses a documented statistical/modeling approach | Coverage, assumptions and implementation matter |
Shopify's marketing-report documentation describes several attribution models and their treatment of credit. Those are specific product definitions, not proof that another tool using the same model name applies identical filtering or identity rules. Shopify marketing reports
Keep model output separate from explanation. An AI assistant can summarize why a rule assigned credit, but it should not invent the inner workings of a proprietary model. Where documentation does not reveal a weighting or identity method, state what is known and what remains undisclosed.
Paid social credit under three simple rules for the same USD 600 synthetic order and 30-day path.
Other touches are email and paid search. Total allocated revenue across all channels stays USD 600 under every rule; no causal lift is measured.
Follow one synthetic order through three models
Consider an illustrative order with USD 600 merchandise revenue, excluding tax and shipping. Its recorded eligible path contains a paid-social click twelve days before purchase, an email click four days before purchase and a paid-search click one day before purchase. Assume a thirty-day window includes all three and identity is known for this synthetic example.
Under first-touch allocation, paid social receives USD 600. Under last-touch allocation, paid search receives USD 600. Under linear allocation, each of the three touches receives USD 200. The store still has one USD 600 order in every case.
| Eligible channel | First touch | Last touch | Linear |
|---|---|---|---|
| Paid social | USD 600 | USD 0 | USD 200 |
| USD 0 | USD 0 | USD 200 | |
| Paid search | USD 0 | USD 600 | USD 200 |
| Total assigned revenue | USD 600 | USD 600 | USD 600 |
Now shorten the illustrative window to seven days. Paid social becomes ineligible. Under the same simple rules, first touch gives email USD 600, last touch still gives paid search USD 600 and linear gives each of those two channels USD 300. This is a rules demonstration, not a claim about a specific platform's implementation.
The interactive tool in this guide uses three different synthetic orders totaling USD 450.01 before refunds, rather than the single USD 600 example above. One USD 150 order is fully refunded, leaving USD 300.01 when the refund control is selected. Choose first, last or equal credit and an inclusive one-, seven- or thirty-day window.
You can also remove observed paid-social touches to see how missing observations change credit. That does not establish that paid social had no influence. Orders with no eligible touch remain unattributed, and equal-credit rounding preserves each order total. The tool does not connect to an advertising account, reproduce a private algorithm or estimate causal lift.
Attribution
Who gets credit under this rule?
Contribution
What remains after the defined costs?
Incrementality
What changed versus a credible counterfactual?
Conceptual guide by Looqus Editorial. Read the surrounding analysis for assumptions, exceptions and primary sources.
Reconcile refunds and revenue definitions
Suppose USD 120 of that synthetic order is later refunded. Net merchandise revenue becomes USD 480. In a simple reporting model that proportionally reallocates retained revenue using the original thirty-day credit shares, first touch assigns paid social USD 480, last touch assigns paid search USD 480 and linear assigns USD 160 to each channel.
That adjustment policy is illustrative. Actual tools can differ in whether, when and how refunds change attribution reports. Google documents sending a refund event with the relevant transaction ID and item information; the merchant must still verify the resulting reports and reconcile them to the commerce record. Google Analytics refund measurement
Define revenue consistently. Gross order value, net merchandise revenue, total paid including tax and shipping, collected cash and contribution are different measures. A channel can show a higher revenue ROAS because its numerator includes charges another report excludes.
Do not call assigned revenue profit. Product cost, fulfilment, payment fees, returns handling and advertising spend need their own treatment. If cost coverage is incomplete, contribution remains provisional even when every marketing touch has an attribution label.
Separate attribution from incremental impact
Attribution asks how credit is assigned among observed or modeled interactions. Incrementality asks what changed because of the marketing activity compared with a credible counterfactual. A customer can click an email before buying even if they would have purchased without that email.
Google describes Conversion Lift as a controlled experiment for estimating causal advertising impact. That distinction matters: the experimental comparison is not the same measurement as ordinary attributed conversions. Eligibility and study design still need to be checked for the actual account. Google Ads Conversion Lift
For a simple synthetic illustration, suppose comparable randomly assigned groups each contain 1,000 eligible people. The treatment produces 90 retained orders and the control 80 during the agreed window. The observed difference is ten orders, or one percentage point. An attribution report might assign credit to far more than ten orders; that does not make all of them incremental.
The observed difference still has uncertainty. Small samples, contamination, unequal exposure or a poorly chosen window can weaken the conclusion. Use a suitable experiment where feasible, or describe a directional analysis honestly. Do not label a before-and-after comparison causal merely because a dashboard calls the output lift.
Use disagreement to diagnose the measurement system
When reports disagree, compare order population, revenue basis, timezone, event duplication, identity coverage, eligible windows, model and data maturity in that order. Save the settings with the report so a later change can be explained.
Give unresolved discrepancies an owner. A broken event identifier needs an implementation correction; missing refunds need a data integration; a misunderstood model needs a reporting explanation. These are different tasks. The work is complete when the corrected evidence or agreed limitation is visible in the decision record.
Begin with one store and a bounded set of channels. Test a purchase, repeat event, second genuine order, partial refund and path outside the window using supported test methods. Verify the commerce record and reporting result before increasing reliance on automated recommendations.
A complex attribution rebuild is a poor first project when order tracking is unreliable, the business has too few conversions for meaningful comparisons or nobody has defined the decision it should support. Repair the transaction record and reporting definitions first. A simple reconciled view can be more useful than an opaque score.
First ask what kind of number you are looking at
A store can have three sensible-looking answers to “What did this campaign earn?” The advertising platform reports conversions under its rules. The store records orders and refunds. A measurement provider connects available interactions to orders and assigns credit. These are different jobs, even when all three screens use the label revenue.
| Layer | What it contains | Decision limit |
|---|---|---|
| Platform-reported | Ad delivery, conversions and values under the network’s settings | Channel claims can overlap; do not add them into store revenue. |
| First-party records | Your orders, refunds and available website/customer records | A recorded purchase does not reveal every influence on the buyer. |
| Model-derived | Allocated credit, inferred missing paths or estimated future outcomes | First-party inputs do not make every output directly observed or causal. |
Northbeam documents orders as its revenue input, platform data as its spend input and pixel events as the connection between them. A problem in one layer needs a different repair from a problem in another. Missing orders need reconciliation; a missing campaign parameter needs collection work; a disputed credit rule needs a measurement decision. Northbeam data inputs.
Before moving budget, save the report’s currency, revenue definition, customer segment, model, window, date basis and extraction time. A comparison without these settings can mistake a reporting change for a change in customer demand. Use a closed period where possible; current-day results are often still developing.
Meta Ads, Google Ads and GA4 answer different questions
Meta Ads reports eligible conversions following supported interactions with Meta advertising. Google Ads reports conversion actions under their selected models and creditable-channel settings. GA4 reports measured key events across its configured acquisition evidence. Even when they describe the same order, the eligible interactions and reporting scope can differ.
| Report | Documented distinction | What to verify |
|---|---|---|
| Meta Ads | Standard attribution and model-based incremental attribution answer different questions | Interaction type, configured window, rollout status and whether an actual lift study ran. |
| Google Ads | Current attribution choices are last click and data-driven | Conversion action, creditable channels, value, window and whether it informs bidding. |
| GA4 | Data-driven, paid-and-organic last click, or Google-paid-channels last click | Event-level attribution versus session/user acquisition, identity and measured channel coverage. |
Meta announced in March 2026 that website and in-store click-through attribution would count link clicks, with other supported interactions moving into engage-through. It also announced a five-second qualifying video threshold and a staged rollout. An engagement threshold describes the interaction; it is not the number of days allowed for a later purchase. Check the actual account labels and configuration rather than assuming an old default still applies. Meta’s measurement update.
Meta’s incremental attribution setting uses machine learning to estimate additional conversions. Meta says advertisers can use it without first running their own Conversion Lift study. “Incremental” in that setting therefore does not mean your business just completed a randomized test of its proposed budget. Meta’s incremental attribution explanation.
Google Ads data-driven attribution compares converting and non-converting paths instead of applying a fixed equal split. The model can inform bidding; inspect the conversion action’s creditable-channel scope rather than assuming every Ads report covers identical channels. GA4’s reporting models are separate: paid-and-organic last click and Google-paid-channels last click can allocate the same measured event differently. Google Ads attribution choices; Google Ads data-driven method; GA4 reporting models.
Windows also differ by product and conversion type. Google documents a thirty-day default click-through window for Search and Display when not customized; GA4’s general key-event lookback is ninety days, with separate first-visit/open rules. These are scoped defaults, not a reason to overwrite a working account’s deliberate settings. Google Ads conversion windows; GA4 lookback and reporting scope.
Finally, distinguish improved measurement from improved sales. Enhanced conversions uses permitted first-party information to improve matching; Consent Mode changes tag behavior in response to consent choices; conversion modeling estimates unavailable measurement links. None is another name for an attribution model, and better matching alone does not demonstrate new demand. Enhanced conversions; Consent Mode; Conversion modeling.
For example, Instagram can qualify for one order after an earlier link click while Google qualifies after a later search-ad click. Event deduplication ensures that each destination receives the purchase correctly. It does not force two independent platforms to share one mutually exclusive credit ledger. Reconcile the order once, then compare the claims.
Triple Whale: decide whether you need channel credit or a reconciled total
Triple Whale offers several attribution lenses. First Click and Last Click choose one interaction. Linear All shares credit across qualifying interactions; Linear Paid restricts eligibility to paid channels. Triple Attribution gives each participating platform full order credit for its last click. Consequently, adding channel rows can exceed actual sales. Triple Attribution plus Platform Views adds platform-reported view-through results and is also unsuitable as a deduplicated store revenue total. Triple Whale model definitions.
Total Impact uses click data and survey-informed channel weights through a proprietary method. A post-purchase survey can reveal that a customer remembers a podcast or another source missing from the click path. It is useful additional evidence, but it is not a controlled test of whether the sale would have happened without that source. Total Impact is not the same product or method as Triple Whale’s separate marketing mix modeling offering.
Clicks & Deterministic Views combines recorded clicks with participating platforms’ verified impression/order matches. The dedicated guide describes fractional normalization, seven-day click half-life and one-day view half-life. It explicitly says its attribution window is not configurable: a carried-over menu selection may have no effect. This differs from the general model guide, so verify model-specific account behavior rather than assuming one window control applies everywhere. Triple Whale deterministic-view behavior.
The dedicated page also describes delayed view updates, limited view-journey drilldown and possible differences from Shopify caused by definitions, filters and matching. Normalization within the model does not guarantee identical totals under different reporting scopes. The published details are not a complete implementation specification; our interactive example does not reproduce this model.
Northbeam: separate the credit rule, the window and the reporting date
Northbeam’s Clicks-Only model is not simply another name for last click. It favors qualifying upper-funnel interactions and excludes designated lower-funnel interactions when upper-funnel touches exist. Clicks + Modeled Views uses engagement patterns and correlations to infer likely view influence; the documentation specifies a one-day view window. Clicks + Deterministic Views instead incorporates verified impressions from participating platforms. These are distinct evidence types. Northbeam attribution models.
| Setting | What changes | What to watch |
|---|---|---|
| Lookback | Which historical touches can receive credit | Changing it restates account history; it can especially affect returning-customer paths. |
| Attribution window | Which already-allocated credit appears within a time interval | A short window need not redistribute all order value to recent touches. |
| Accrual Performance | Credit appears on the interaction date | Older marketing cohorts can gain credit as later purchases arrive. |
| Cash Snapshot | Credit appears on the purchase date | Use a matching revenue definition for reconciliation; attribution-window controls are unavailable. |
These distinctions are documented in lookback settings, attribution windows and credit allocation examples. The earlier generic example in this guide changes eligibility before reallocating the order. It is not a simulation of Northbeam’s separate reporting-window filter.
Northbeam’s deterministic-view guide describes paid-touch precedence and platform pooling. Unsupported platforms do not receive additional view credit, and individual in-app views are not available in order drilldown. The public examples do not disclose enough detail to recreate every allocation. A verified match establishes that an exposure can be connected to an order; it does not establish what would have happened without the exposure. Northbeam deterministic-view documentation.
A joined customer journey is not a complete record of the buyer
Imagine a customer discovering a product on a phone and purchasing on a laptop. The measurement system needs an allowed, reliable link between those activities. Without one, the purchase can remain unattributed or part of the path can be inferred. A clearer-looking journey is not automatically a more accurate one.
Triple Whale describes an identity graph combining deterministic and probabilistic methods. Northbeam likewise discusses exact identifiers alongside inference for anonymous or cross-device paths. These are vendor descriptions, not independent accuracy tests. Neither warrants claiming every device switch is recovered. Triple Whale identity explanation; Northbeam identity approaches.
Check the mundane failures first. Northbeam documents how a missing checkout token or order identifier can prevent a browser purchase from matching the server order. Its supported identity methods have integration requirements. A model cannot compensate for every broken checkout connection. Northbeam checkout matching.
For a buying decision, ask what proportion of the report is observed, matched or modeled, what can be exported, and which limitations cannot be inspected at person level. Keep customer information within approved access and data-sharing arrangements. Server-side reporting is not permission to bypass a customer’s choices. Unknown should remain an acceptable state, not something a team is rewarded for hiding.
A higher channel ROAS can leave the business with exactly the same money
Independent synthetic USD example: one order contains $200 merchandise revenue after discount, excluding tax and shipping. A $40 refund leaves $160 retained sales. Its eligible click path is paid social, email and paid search, in that order. The table deliberately uses simple rules, not either vendor’s proprietary output.
| Rule | Social | Search | Total | |
|---|---|---|---|---|
| First click | $160.00 | $0.00 | $0.00 | $160.00 |
| Last click | $0.00 | $0.00 | $160.00 | $160.00 |
| Equal click credit | $53.34 | $53.33 | $53.33 | $160.00 |
The remaining cent goes to the first eligible touch in this example. Do not add these rows: they are alternative interpretations of one sale. A platform report could separately claim the full $160 for social and search. Those $320 of overlapping claims still describe only $160 retained sales.
Suppose this reporting period has $40 social spend, $20 search spend and no other orders. First-click ROAS is 4.0x for social and zero for search. Last-click is zero for social and 8.0x for search. Under equal credit, the figures are approximately 1.33x and 2.67x. A new model can change the apparent winner without changing the transaction.
Now include $70 product cost and $20 variable fulfilment, payment and return-handling costs. The business retains $70 before advertising and $10 after the $60 advertising spend, before fixed overhead. That $10 does not change when attribution changes. The refund allocation here is an explicit learning convention, not a claim about vendor refund defaults.
Measure extra contribution before assuming extra revenue pays for growth
In a separate synthetic experiment, randomly assigned treatment and control groups each contain 10,000 eligible people. Over the same completed observation and refund horizon, treatment has 500 retained orders and control has 400. Assume one retained order per purchasing person and analyze people as assigned.
| Measure | Calculation | Result |
|---|---|---|
| Absolute lift | 500 / 10,000 − 400 / 10,000 | 1 percentage point |
| Relative lift | (5% − 4%) / 4% | 25% |
| Estimated extra orders | 1% × 10,000 | 100 |
| Extra revenue at constant $80 per order | 100 × $80 | $8,000 |
| Incremental revenue ROAS | $8,000 / $4,000 extra spend | 2.0x |
| Extra contribution after advertising | $8,000 × 40% − $4,000 | −$800 |
The last line assumes a 40% incremental contribution margin before advertising. Revenue increases, yet the tested spending loses $800 before fixed costs. If order values differ, measure revenue per assigned person rather than assuming constant average order value. If group sizes differ, compare rates or an appropriate adjusted estimate, not raw order counts.
Geographic tests need adjustment for baseline differences and a credible comparison for what would have happened without the intervention. Triple Whale documents synthetic controls, credible intervals and inconclusive results; Google describes Conversion Lift as a controlled experiment. GeoLift design; Reading lift uncertainty; Google Conversion Lift.
Agree the test, duration and decision threshold before launch. Watch for stockouts, uneven promotions, spillover, lag and changes to the planned intervention. An inconclusive result is not proof of no effect. A successful test at one spend level also does not prove the next budget increase will perform equally well.
Use MMM for the budget response, not another version of the customer journey
Marketing mix modeling works with aggregate performance over time. It can estimate how channels, pricing, promotions and other factors relate to outcomes, including channels that do not leave a usable click path. Its budget response curve asks what an additional spending increment might produce; average historical ROAS asks a different question.
Triple Whale describes a Bayesian MMM using carryover and diminishing-return effects, with roughly twelve months of history for an initial model and eighteen to twenty-four recommended. Northbeam’s MMM+ describes MTA inputs, external factors, promotions and frequent forecasting. These are vendor-specific descriptions, not universal requirements or guarantees. Triple Whale MMM; Northbeam MMM+.
In plain English, carryover means yesterday’s advertising may still matter today. Diminishing returns means the next dollar need not work as hard as the first. If channels always rise together, the model may struggle to separate their effects. If stockouts or promotions are omitted, it may assign their effects to marketing instead.
Ask for uncertainty ranges, sensible response curves, relevant business inputs and checks against experiments. Do not treat attribution, MMM and lift as three independent votes when they share data and assumptions. Triple Whale says meaningful disagreement between signals should be surfaced, not silently averaged. How measurement disagreement is handled.
A weekly review that ends with a decision and an owner
Start with total net sales and contribution, then separate first-time customers from returning buyers. Compare acquisition cohorts at the same age: a recent group has not had the same opportunity to reorder as a mature one. A channel can look strong because it reaches existing customers, while the business needs profitable new-customer growth. Northbeam’s metric definitions distinguish customer groups and date-dependent measures; your finance definitions must be equally explicit.
| Step | What the team establishes | Decision output |
|---|---|---|
| Reconcile | Orders, refunds, spend and costs use one agreed scope | Fix missing records before reallocating budget. |
| Compare | Models are viewed with recorded settings and mature data | Name the disagreement that could change spending. |
| Check economics | New-customer and repeat contribution support the proposed return | Set a contribution threshold and cash limit. |
| Test the important uncertainty | Use a feasible lift test or qualified MMM scenario | Approve a bounded change, not an open-ended scale instruction. |
| Close the loop | An owner verifies execution and reviews results on a set date | Continue, adjust, stop or investigate with recorded reasons. |
Before buying a measurement tool, ask for one real example of how it reconciles an order and refund; how it labels modeled data; which settings restate history; what exports you receive; what experimentation requires; and who resolves discrepancies. Ask these using your business requirements, not an invented universal accuracy score.
A complex rebuild is a poor fit when order records are unreliable, volumes are too small for the proposed analysis or no budget decision depends on the result. Start with reconciliation and a clearly defined question.
Sources
- Google Analytics: Ecommerce and refund measurement
- Google Analytics: Transaction-ID deduplication
- Google Analytics: Reporting identity
- Google Analytics: Attribution settings
- Google Ads: Attribution reports
- Shopify: Marketing reports
- Google Ads: Conversion Lift
AI does the work.We own the outcome.
Reconcile the reports behind your spending decisions, with checked revenue definitions, clear measurement limits and an owner for resolving the differences that matter.
- Agree the result
- Connect the work
- Own the follow-through